Naïve Bayes
Classifying Tweets
In this section of the project I will be performing Naïve Bayes classification using Twitter data relating to school shootings. The original intent of this section was to classify tweets based on their political sentiments, but we explain further in the section why that approach is neither responsible nor viable. Instead, we classify tweets based on their intent—whether they are expressing opinions or sharing news.
I have a corpus of about 2.5 million tweets mentioning school shootings, which I obtained using the academic access Twitter API. The labels I will use to train my Naïve Bayes model will come from hashtags in the tweets. I will identify some of the most common hashtags in my corpus to identify classes of interest, and I will then train a Naïve Bayes algorithm to group tweets into these classes. The top ten most cited hashtags in the corpus are as follows:
| Hashtag | Count |
|---|---|
| #shooting | 9,754 |
| #news | 8,014 |
| #school | 7,519 |
| #gunviolence | 2,761 |
| #guncontrol | 2,567 |
| #schoolshooting | 2,437 |
| #guncontrolnow | 2,407 |
| #nra | 2,277 |
| #shooter | 1,715 |
| #parkland | 1,711 |
While the original intent of this analysis was going to be prediction of the political standing of each tweet based on the hashtags, the value counts have shown that the data are too biased for this kind of approach. The vast majority of hashtags included in tweets are in favor of gun control, which makes sense because the tweets were queried specifically in connection to individual school shooting incidents. The majority of expressed sentiment after a tragic school shooting incident would understandably be to tighten gun laws. I believe that it is for this reason that the value counts of the hashtags are highly imbalanced, with far greater gun control sentiment over gun rights sentiment.
The other issue with this approach would be the ambiguity associated with each label. If we were to treat hashtags as the labels classifying whether a tweet supports stricter or looser gun laws, it is entirely possible that a given hashtag could appear in either type of tweet. For example, a hashtag #nra may appear in a tweet that criticizes National Rifle Association (NRA) agendas or it may appear in a tweet that supports them. These biases in the data have forced a new approach.
Instead of predicting a tweet's political standing, we will instead classify tweets as "News" tweets or "Opinion" tweets. The labels for this analysis will be applied based on the type of hashtags used in the tweet. Hashtag classifications are defined below.
| News | Opinion |
|---|---|
| #news | #guncontrolnow |
| #breakingnews | #gunsense |
| #gunreformnow | |
| #neveragain | |
| #endgunviolence | |
| #stopgunviolence | |
| #enoughisenough | |
| #nrabloodmoney | |
| #rejectthenra | |
| #enough | |
| #momsdemand |
With these hashtag classification criteria, we now assign these class labels to the tweets that contain the hashtags of interest. The value counts for these tweets are as follows:
| Label | Count |
|---|---|
| Opinion | 21,154 |
| News | 18,251 |
| Both | 82 |
The "Both" label represents tweets tha have hashtags from both classes in them. Impressively, there are only 82 of them. We examine the content of a couple of them below:
“We’re expected to be human shields”: Teachers are unprotected — and scared https://t.co/11ehIs3AuH #news #feedly #education #teachertwitter #GunControlNow
— Fat Puppy Productions (@FatPuppyProduc1) June 13, 2022
Enough. This has to stop. #UvaldeMassacre #UvaldeStrong#truecrime#truecrimecommunity#BREAKING#BreakingNews#Enoughhttps://t.co/lQ3wbaiCh0
— thiscountrygirlslife (@countrygrllife) May 25, 2022
Clearly the "Both" class has some tweets that fall under "Opinion" tweets and some that fall under "News" tweets. The first tweet shown above would likely be considered a "News" tweet even though it contains hashtags that we define as being opinion-based. Likewise, the second tweet would probably be considered an "Opinion" tweet even though it contains a "News" hashtag. Luckily the number of tweets in this "Both" class is so small that it won't be necessary to include them in our training dataset. Our "Opinion" and "News" classes are roughly balanced (have about the same number of tweets belonging to each class), so we will proceed with training the Naïve Bayes classifier on these data.
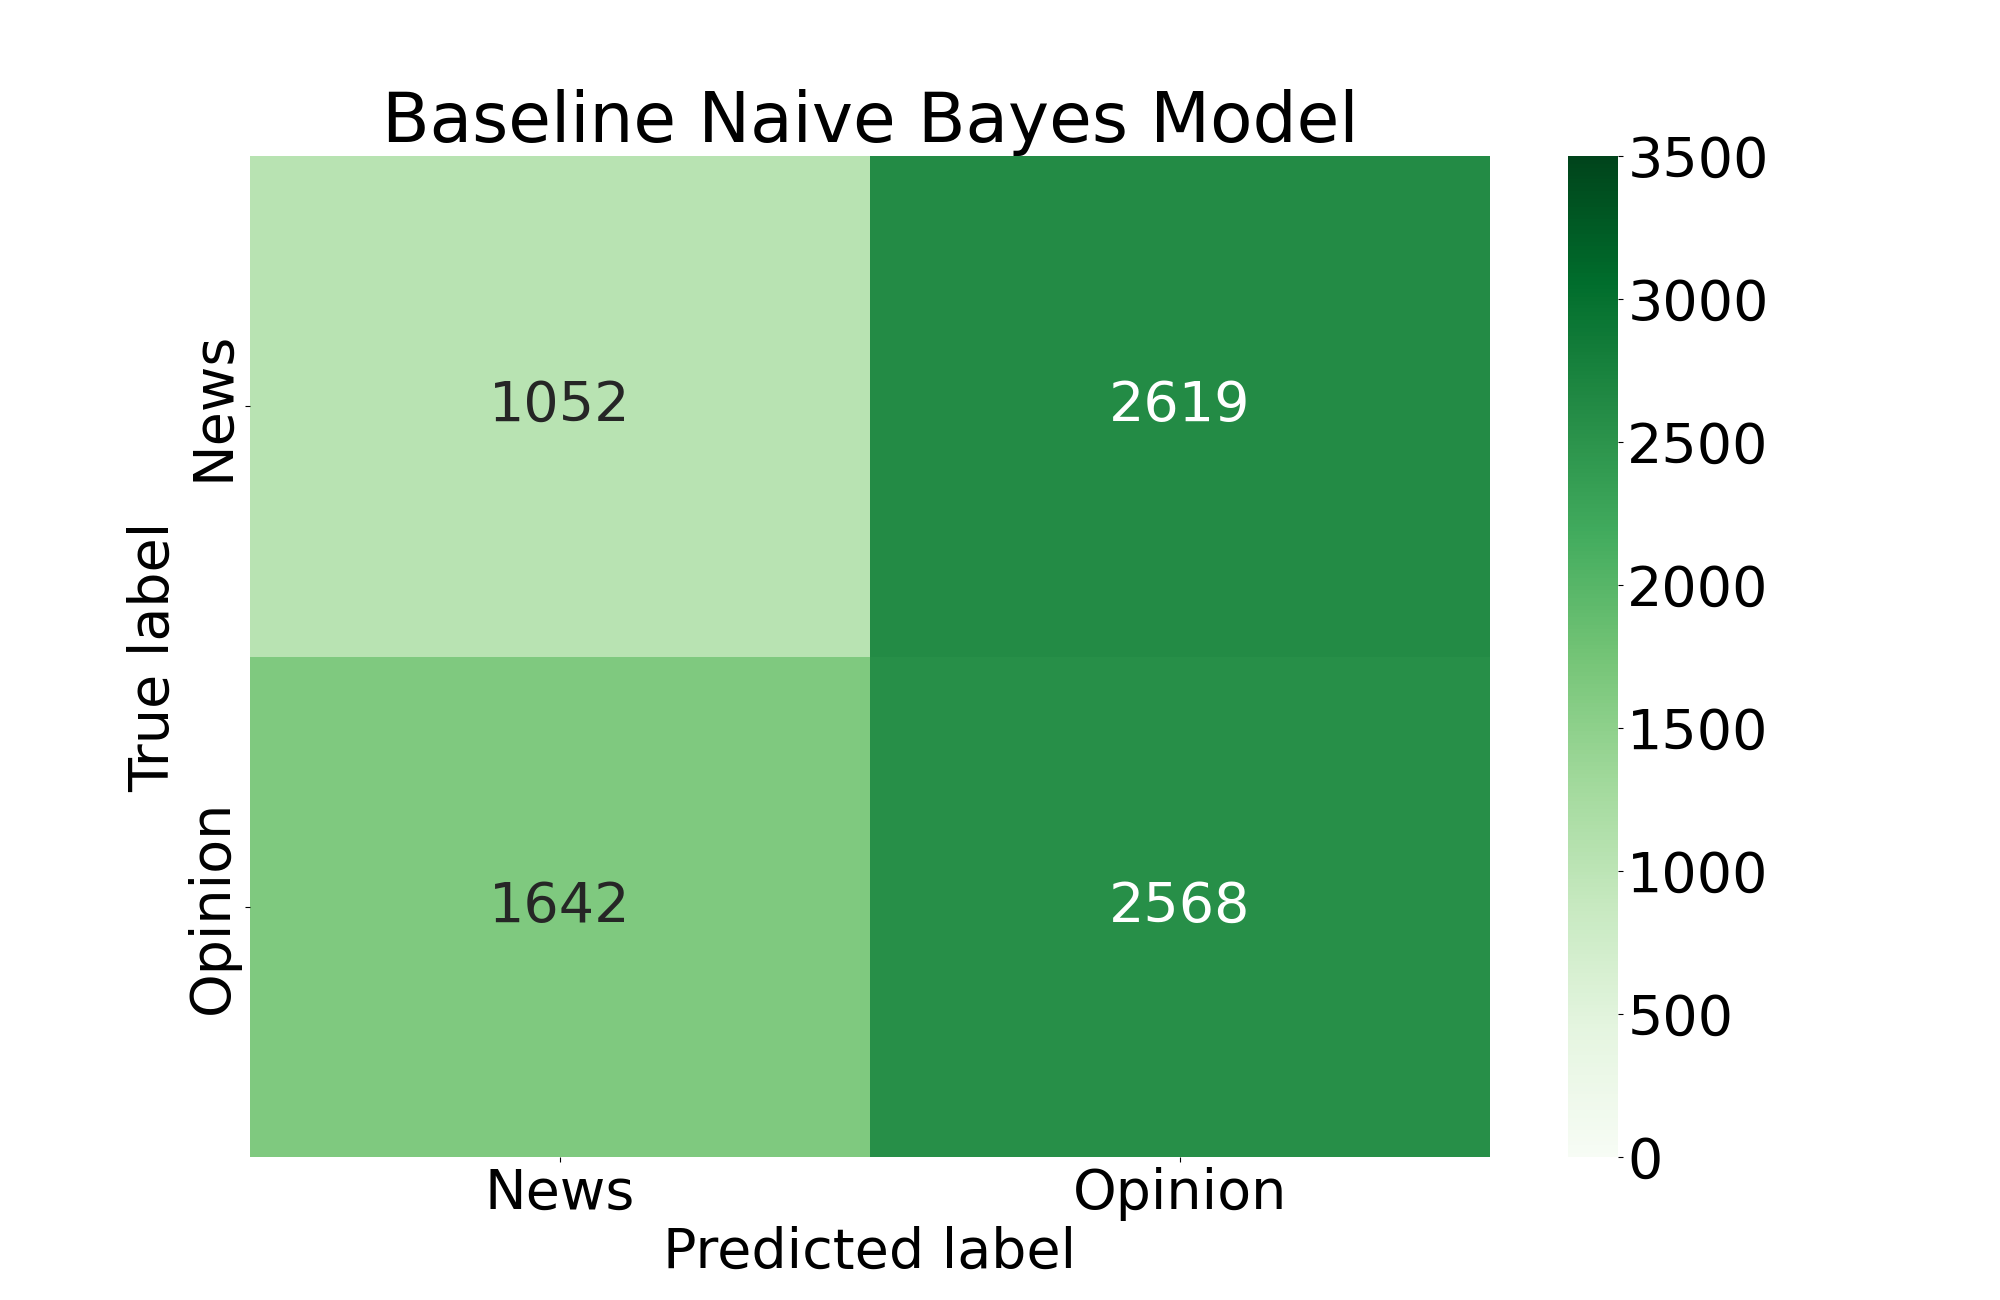
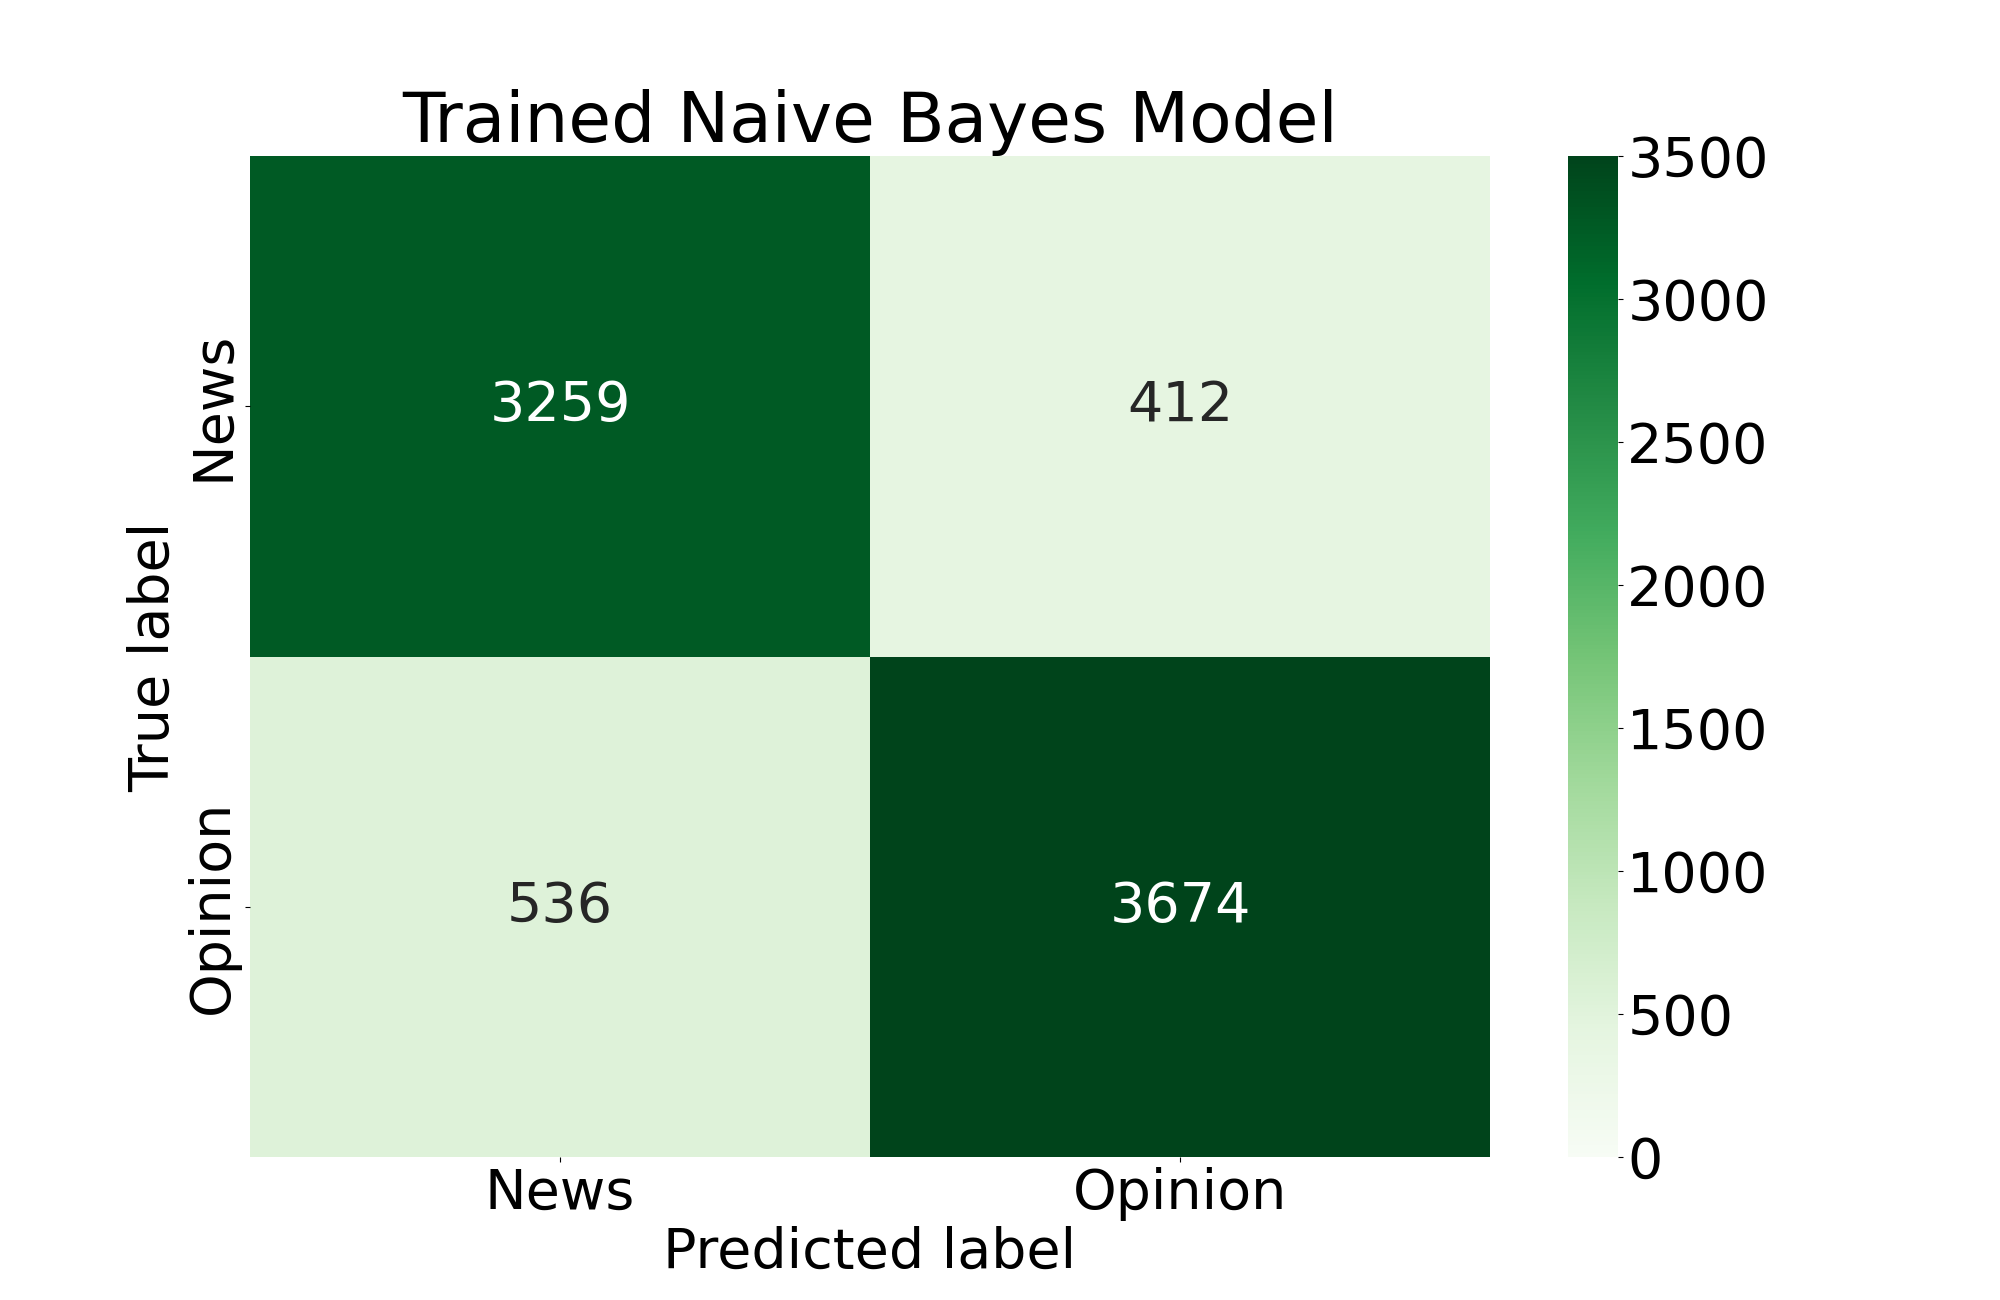
With the classifier trained, we examine its performance using confusion matrices and numerical metrics. We can get the best impression of the classifier's performance by comparing it to a "baseline" model, or a model that is trained on completely random data. In the confusion matrices below, each square represents a classification group that a number of tweets belongs to. Working clockwise from the top left, the squares represent: tweets that were correctly classified as "News" tweets, "News" tweets that were incorrectly classified as "Opinion" tweets, tweets that were correctly classified as "Opinion" tweets, and "Opinion" tweets that were incorreclty classified as "News" tweets.
We can also use metrics to compare the performance between the two models. The definitions of these metrics are defined as:
- Accuracy: The ratio of correct classifications to all classifications.
- Precision: The ratio of true positives to the total number of true positives and false negatives. In this case, we define the positive class as a "News" tweet. Thus, in this scenario precision represents the classifier's propensity for correctly classifying "News" tweets.
- Recall: The ratio of true positives to the total number of positives classified. In this case, we define the positive class as a "News" tweet. Thus, in this scenario recall represents the classifier's propensity for minimizing misclassification of "Opinion" tweets.
- F1: The harmonic mean between precision and recall. In this scenario, it serves as a combination between the classifier's ability to correctly classify "News" tweets while minimizing misclassification of "Opinion" tweets.
The results of the metrics are:
| Metric | Trained Model | Baseline Model |
|---|---|---|
| Accuracy | 0.878 | 0.486 |
| Precision | 0.861 | 0.430 |
| Recall | 0.881 | 0.315 |
| F1 | 0.878 | 0.499 |
In conclusion, the model is quite good at classifying tweets as either "News" tweets or "Opinion" tweets. As in many machine learning algorithms, the model is only as good as its data. The use of hashtags as proxies for labels in this corpus of tweets about school shootings was certainly less than perfect, and therefore results in a poorer model.
It is worth noting that this model was trained and tested exclusively on tweets with hashtags belonging to the classification dictionaries defined above. In total, this set of tweets totals to 39,405 tweets out of the total 2,485,482 tweets we retrieved using the Academic Research Twitter API. This offers an interesting opportunity to apply the model to the remaining 2.4 million tweets about school shootings, gaining insight into the variance between "Opinion" tweet frequency and "News" tweet frequency over time. This will be a point of future analysis, and will be updated here once performed.
Predicting News Coverage
The School Shooting Database offers a "News Coverage" feature in its dataset that indicates the level of media attention a given school shooting demanded. We are interested in whether factors such as a school's level (Elementary, Middle, High), racial demographic (percent of Black, Hispanic, Asian, and White students enrolled), and the number of fatalities resulting from the incident can accurately determine the level of news coverage (local, regional, national, or international) that the incident receives.
We emphasize the intent of this analysis as uncovering insights into past incidents, and in no way do we intend to draw any conclusions on school shooting incidents that may occur in the future.
In order to retrieve racial demographic data on United States schools we use the Urban Institute Education Data API to retrieve the desired data released by the Common Core of Data (CCD). Because the SSDB does not include National Center for Education Statistics IDs in its dataset, we create an artificial "pseudo-ID" composed from the year in which the data was gathered / the incident occurred, the two letter abbreviation of the state, the name of the city (excluding spaces), the first five characters of the school name, and a flag indicating whether the school is a high school or not (1 if yes, 0 if no). Despite the thorough construction of this pseudo-ID to link the SSDB data with the CCD data, only 781 schools were successfully linked between the two datasets out of 2,068 incidents in the SSDB. This major loss of data may adversely affect the performance of the Naïve Bayes model, and may be an area to return to for future work.
Another source of significant bias in this analysis may be the magnitude of missing data for the levels of media attention for each incident. Out of the 781 incidents with linked school data, 596 of them are missing information on the level of media coverage. After accounting for this and other missing data, the dataset is reduced to 133 school shooting incidents. The classes of media coverage for the incidents in the set are distributed as follows:
| Local | Regional | National | International |
|---|---|---|---|
| 89 | 13 | 24 | 7 |
The results of the Naïve Bayes classification can be seen below.
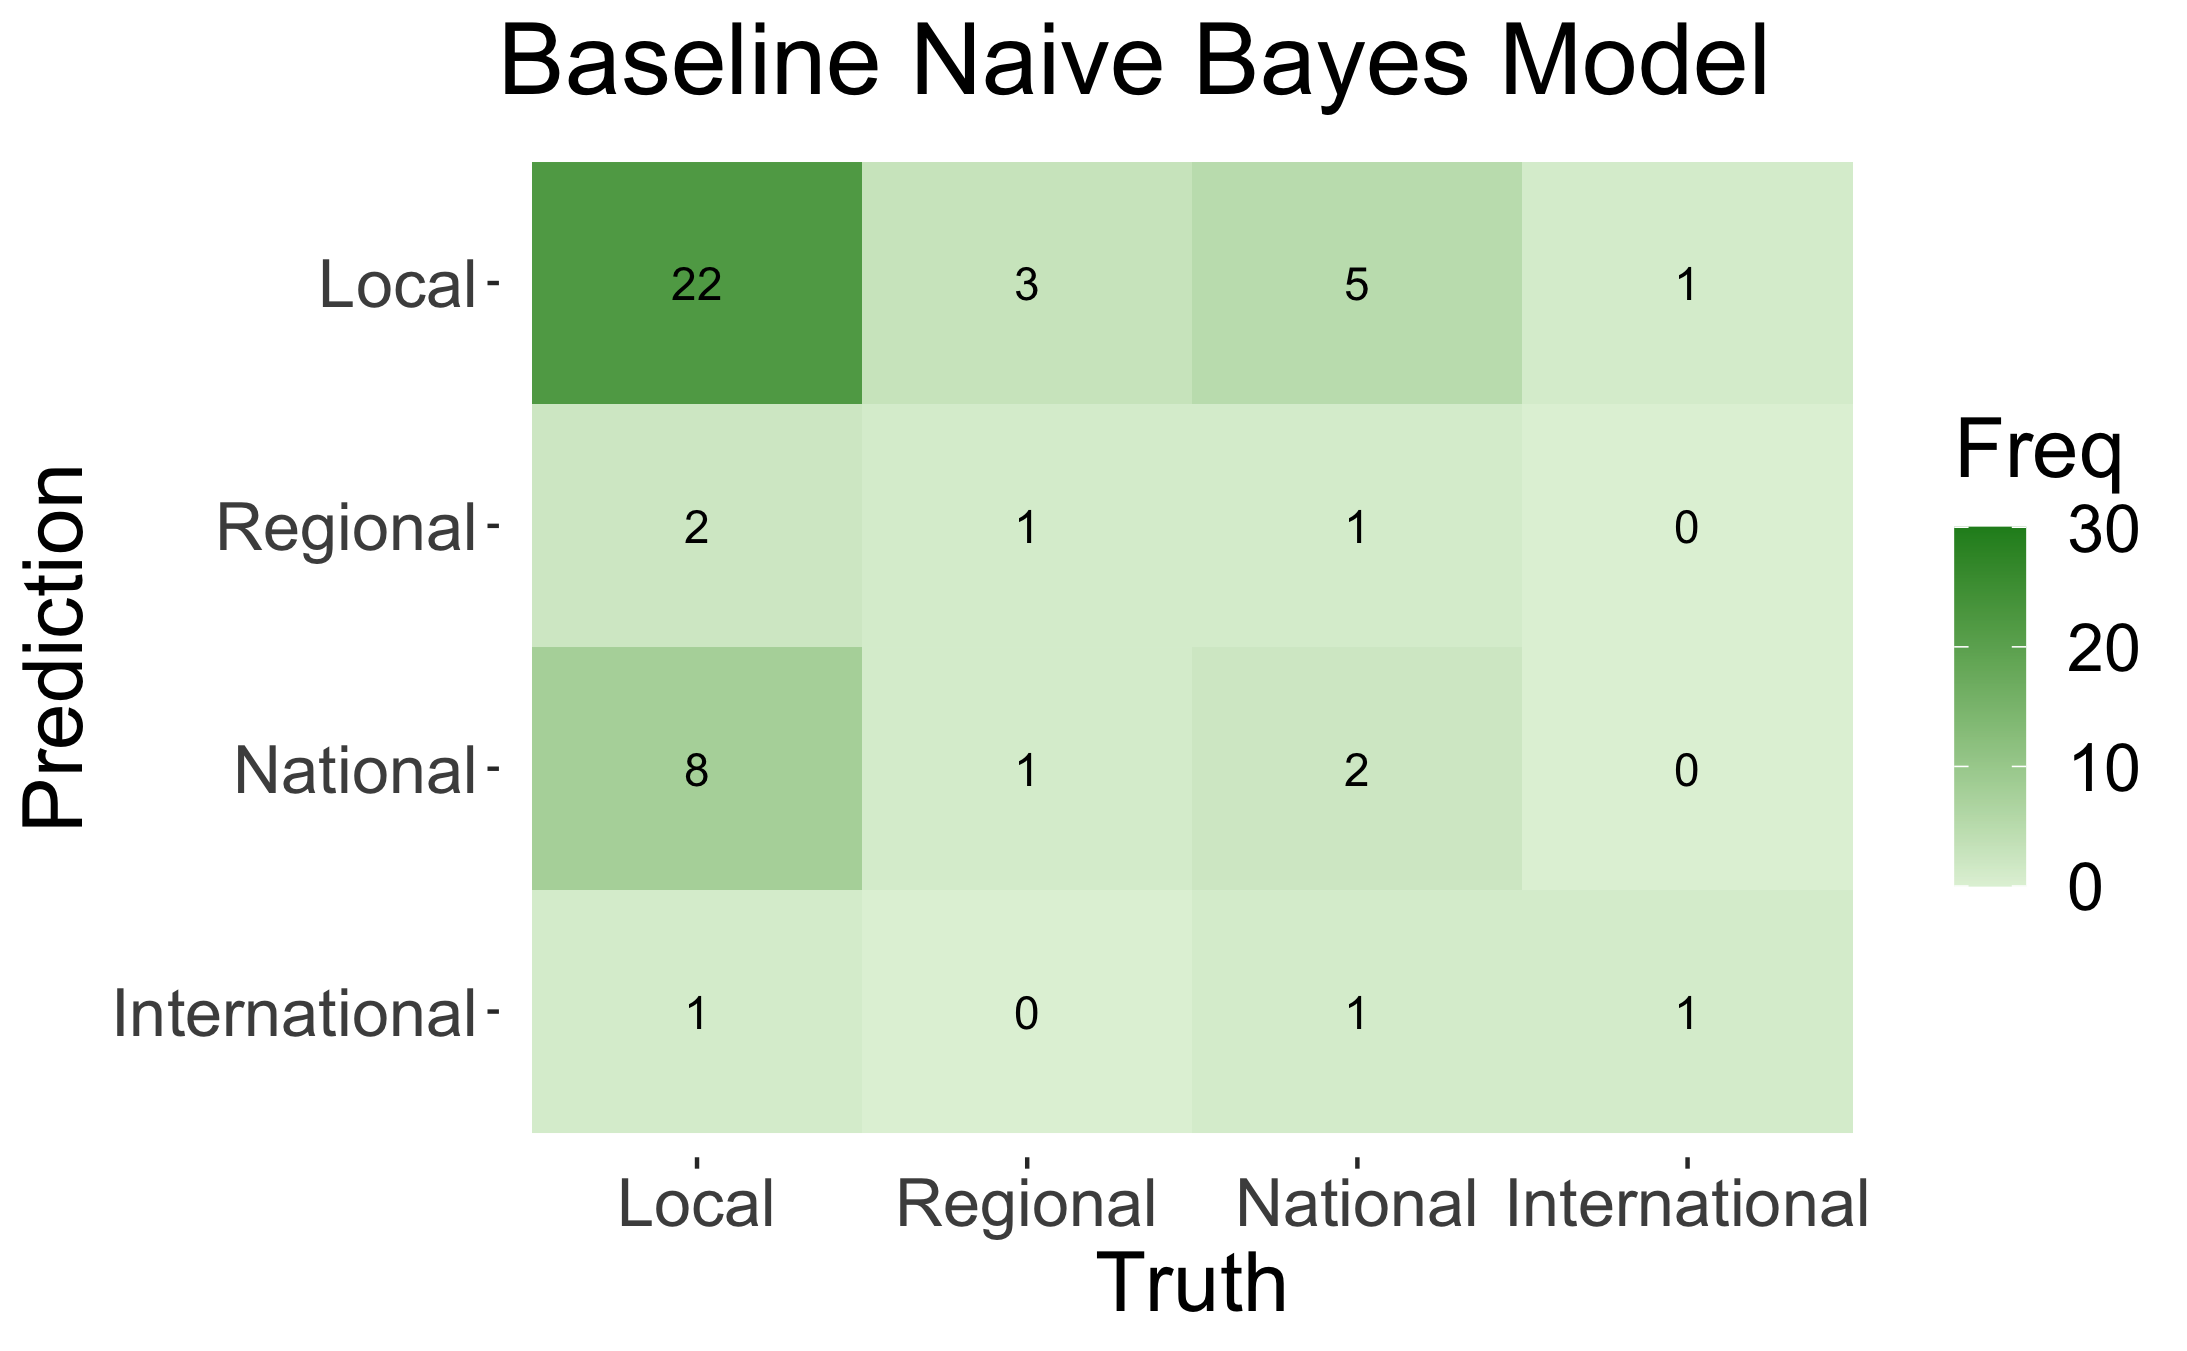

Although the trained model performs much better than the baseline at predicting whether an incident's coverage will be local or not, for the most part the model isn't great at determining the level of news media. However, we can see from the accuracy below that the model is at least better than a random predictor, so it has some value.
| Trained Model | Baseline Model | |
|---|---|---|
| Accuracy | 0.529 | 0.373 |
This model can definitely use some work, but once it proves stronger performance it may offer value into filling some of the vast missing data for each school shooting incident's level of media attention. Having predictions for this data on all incidents could offer very interesting insights into the aspects of school shootings that the public deems most tragic about school shootings (or at the very least, insight into what the media perceives the public to deem most tragic about school shootings).